Practical performance advice for website owners
Using Query Monitor for WordPress Speed: Investigate Requests, Not Just Plugin Counts
Need hands-on help? Request a Speed Review →
WordPress performance advice · Reviewed 3 November 2026
In this guide
A slow WordPress request can involve several plugins, templates and external services. Query Monitor is a diagnostic tool that can help a developer inspect parts of that work. It provides evidence, not an automatic repair or a reason to delete whichever plugin appears first.
Choose the request to investigate
Start with a reproducible slow URL or administrative action. Record the visitor state, data involved and whether the route normally uses page caching. A logged-in diagnostic request may differ from a public cache hit.
Define the question before installing or running a tool. For example, investigate a slow uncached category page rather than collecting every diagnostic panel without a hypothesis.
Use an appropriate environment
Follow the tool’s current documentation and the site’s access process. Staging is useful for controlled comparisons, while production diagnosis needs consideration of overhead, privacy and operational load.
Do not publish diagnostic output to visitors. Logs and screenshots can reveal paths, query details or information related to business records. Share only the evidence needed with the authorised people.
Read the panels in context
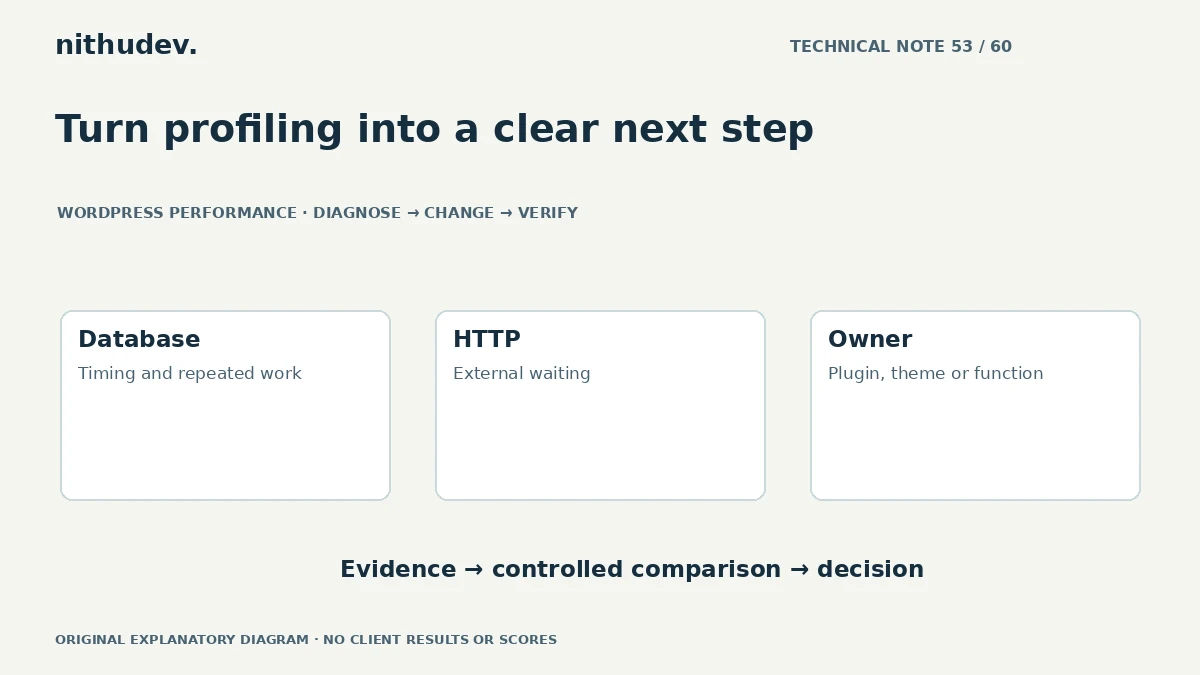
- Database timing and repeated queries can identify investigation leads.
- Component grouping can help trace work to a plugin, theme or function.
- HTTP-request information may reveal external waiting.
- Errors and notices can explain a separate failure.
A high query count is not automatically the dominant cost. Timing, data volume, cache behaviour and the task’s requirements all matter. A component may also call another service or trigger work indirectly.
Confirm a suspected cause
Make one controlled change on an appropriate test environment, then repeat the same request. Keep the visitor state and data comparable. Check the functionality supplied by the suspected component as well as the timing.
Removing a feature makes its work disappear, but that does not establish an acceptable business solution. Consider supported configuration, conditional loading or a targeted code correction before replacing an essential integration.
Keep browser work in the investigation
A backend profile does not fully describe image transfer, rendering or slow interactions after load. Combine the relevant server evidence with network and browser traces. Report which tool measured which part.
For commerce, verify dynamic totals, sessions and payment controls after any change. A faster diagnostic request is not proof that a complete purchase succeeds.
Finish with a useful recommendation
The report should name the affected request, observed bottleneck, likely owner, proposed fix and acceptance test. Record uncertainty where a dependency or access limitation prevents confirmation.
Agree what happens to diagnostic tooling and logs after the review. Installing another plugin is not the intended outcome; a well-supported decision about the performance problem is.
Work directly with Nithu
Get help with your WordPress performance
If the cause of a slow request is unclear, I can use appropriate profiling to narrow the issue and separate measured evidence from assumptions.
Request a Speed ReviewCompare the $79, $179 and $349 one-time packages →
No payment is needed for an enquiry. Scope is confirmed before work; paid tools, hosting and out-of-scope development are separate unless agreed. No fixed score or ranking guarantee.
Technical references
Written for website owners planning performance work. Technical options depend on the installed versions, hosting and integrations. Test changes safely and retain a recovery path. The featured diagram is an original editorial illustration, not a measured result or customer case study.